Quick Bite – Buffett Barometer Flashing Amber
For most, comparing market capitalisations to the GDP of a country is usually a bit of a nonsense. GDP is a flow concept, economic activity over a year; market value, or market capitalisation, is a stock concept, a snapshot of all the shares of a company multiplied by their latest share price at a particular point in time.
But it always pays dividends to listen to the Sage of Omaha. Warren Buffett did something valuable did when he popularized the “Buffett Indicator,” the ratio of the total US stock market value to the country’s GDP.
Once hailed by its namesake investor as “probably the best single measure of where valuations stand,” that indicator just hit an alarm-ringing 223% — its highest level on record, adding to the chorus of market commentators who think we might be in for a correction.
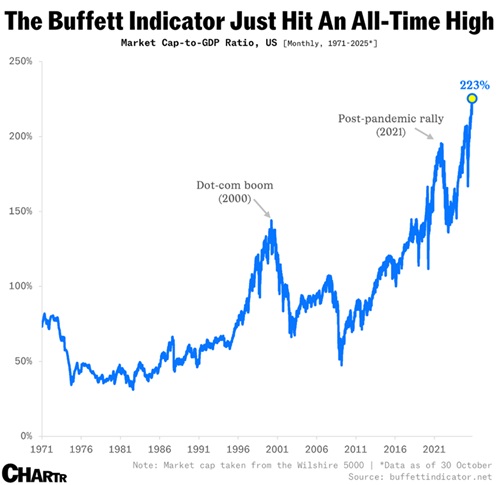
Source: CHARTR
Back in 2001, Buffett warned that the metric nearing 200% would mean “playing with fire.” If the stock market value is growing much faster than the actual economy, then it may be in a bubble.
But, parallel to the valid concerns, there are legitimate reasons to not place too much weight on this particular indicator at this time. Indeed, Warren Buffett himself has since walked back those comments, hesitating to endorse any single measure as either comprehensive or consistent over time, but this ratio is still credited to his name.
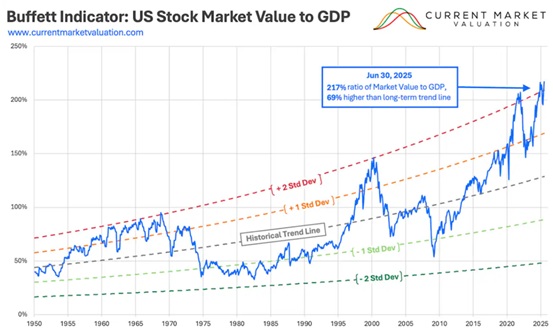
Source: CurrentMarketValuation.com
Given that the stock market value represents the present value of expected future economic activity, and that GDP is a measure of most recent actual economic activity, the ratio of these two data series represents expected future returns relative to current performance. In a sense, it is similar to the P/E ratio of a particular stock. If there is no reason to believe that the growth rate will materially change, it stands to reason that this ratio would remain relatively stable over time, increasing slowly as new technology creates more efficient returns from labour and capital.
So, is it different this time?
For starters, America’s corporate giants are simply more global than ever — which makes their value look inflated compared to a purely domestic GDP. In fact, nearly half of the Magnificent 7’s revenue comes from overseas, as per Goldman Sachs.
Furthermore, today’s corporate giants have never been better at turning revenue into profit, with the S&P 500 enjoying record operating profit margins of around 14% on a forward basis, the highest ever. That’s why profit-based valuation measures are a little less scary – and they become less remarkable once adjusted for future growth. The market’s PEG ratio is in a fairly typical range, for example (though you must believe the forecasts, which is a separate discussion altogether).
With that backdrop, and with falling interest rates, and expectations of AI changing almost everything … some investors are not too worried, and are happy to follow the momentum. They say, “The trend is your friend”.
But alongside the Buffett Indicator, other metrics are flashing amber too. Investors are paying record prices for every dollar of future S&P 500 revenue, and the market is increasingly concentrated in a handful of MegaCaps, with 8 tech stocks now responsible for ~40% of the S&P 500 Index’s value.
Those of us who have seen booms and busts over decades know that “it is never really that different”. Markets extrapolate, narratives become entrenched, valuations become unrealistically stretched, and animal spirits run wild. Markets always overshoot. Now is a good time to re-examine your investment objectives with the assistance of a professional advisor, analyse your asset allocation exposures, and ensure your investment portfolio remains fit for purpose. Remember the adage: “Trees don’t grow to the sky.”
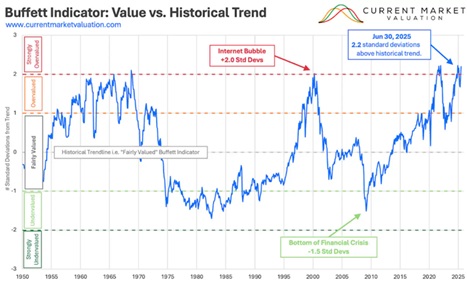
Source: CurrentMarketValuation.com

