Quick Bite – Are We in a Stock Market Bubble?
“At the root of all financial bubbles is a good idea carried to excess.” – Seth Klarman
“One of the important factors behind the fluctuation between bull and bear markets, between booms and crashes and bubbles, is that investor memory has to fail us – and fail universally – in order for the extremes to be reached.” – Howard Marks
“History shows us, over and over, that bull markets can go well beyond rational valuation levels as long as the outlook for future earnings is positive.” – Peter Bernstein
“Booms start with some tie-in to reality, some reason which justifies the increase in asset values, and then — and this is the critical feature of speculative mood — the market loses touch with reality.” – John Kenneth Galbraith
A few quotes above relating to stock market booms and bubbles. These writers are no doubt very smart, yet even they would be hard pressed to know with any certainty if we were inhabiting a stock market bubble. Bubbles inflate and grow to excess before suddenly popping. Only in retrospect can one point to a period of excessive exuberance and say, “That was a bubble”.
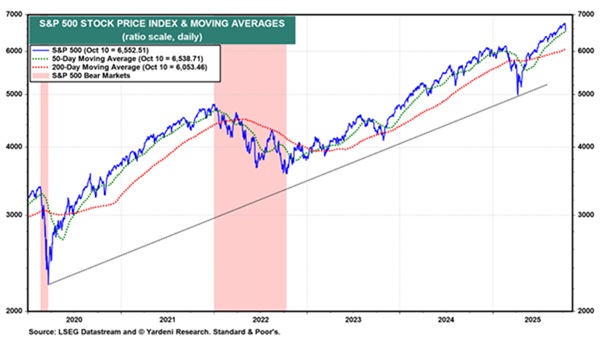
Source: Yardeni Research
Last Thursday, the key US S&P 500 benchmark index hit its 33rd record high of the year, up around 13% over the last year. A key theme of the market has been the superlative performance of the mega-Tech names, aptly called the “Magnificent 7”, and the emergence of Artificial Intelligence, leading to an unusual degree of market concentration on these tech leaders.
The comments below refer mainly to the US market rather than global sharemarkets in general or the Australian market.
Is this a Bubble?
Bubbles are historically driven by an exuberance that builds around a transformative technology, attracting investors, capital and new entrants. “Typically, bubbles exhibit rapidly rising asset prices, extreme valuations and significant systemic risks driven by increased leverage” – Goldman Sachs.
The US market is experiencing the most extreme valuations, in both absolute and relative terms.
The chart below uses 12m forward P/E multiple; MSCI Regions; STOXX 600 for Europe; and S&P 500 for USA. Data since 2003.
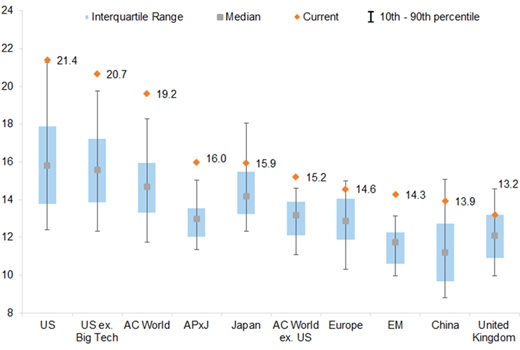
Source: Goldman Sachs
There are elements of investor behaviour and market pricing currently that appear quite similar with previous bubbles, including the rise in valuations and high market concentration.
However, there are also differences:
- The appreciation of the technology sector has mostly been driven by fundamental growth rather than irrational speculation about future growth.
- The leading companies (such as the Mag 7) that have seen the strongest returns have unusually strong balance sheets.
- The AI space has, so far, been dominated by a few incumbents; most bubbles form in a period of huge competition as both investors and new entrants flock into the space.
Bubbles tend to develop when there is a combined surge in stock prices and valuations to an extent that the aggregate value of companies associated with the innovation exceed the future potential cash flows that it is likely to generate. Valuations of the technology sector are becoming stretched but probably not yet at levels consistent with historical bubbles.
And yet valuations in equity markets are certainly at high levels relative to their history. The most extreme is the US where current P/E ratios are above their previous 20-year high. However, it is notable that underlying profitability and high returns on equity may be an explanation for the rise in valuations. The ROE of the US market – largely driven by the technology sector – is well above its previous 20-year high and well above that achieved in other regions.
Tech earnings have outstripped those of the global market. Chart below shows 12m trailing EPS (USD). Indexed to 100 on Jan-2009.
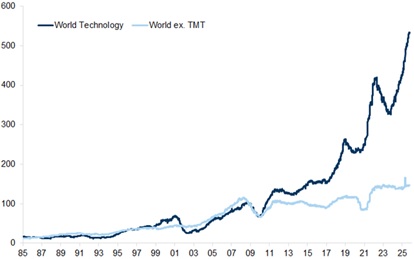
Source: Goldman Sachs
Regarding the Mag 7, valuations are high but by no means as high as during previous bubbles. The median 24 month forward P/E ratio across the ‘Magnificent 7’ is 27x (or 26x if excluding Tesla which has a much higher multiple than the other companies). This is roughly half the equivalent valuation of the biggest 7 companies in the late 1990s, while the dominant companies in Japan (mostly banks) traded at higher valuations still. It is true that valuations are high but generally not at levels that are as high as are typically seen at the height of a financial bubble.
Of course, there are many ways to measure value, and price earnings multiples are but one methodology. We could also note PEG ratios (price to growth), price to book value, dividend discount models, etc and many other valuation techniques. Most would provide similar signals to the PE ratios already noted.
One reason why valuations are probably not yet at bubble levels is to compare returns in this past year – disaggregated between earnings, valuation and dividends – with returns in the 12-months before the peak in the dot-com bubble. Back in 1999/2000, there was a much greater rise in valuation driven by multiple expansion rather than by earnings growth. And for European telecoms the valuation ascent was even steeper, with returns driven almost entirely by valuation rather than earnings. Today, earnings growth has been the primary factor driving rising prices.
The performance of tech companies in the early 2000s was more heavily influenced by high valuations than by earnings. In chart below: 12m return, trailing and before Tech Bubble peak, in local currency – S&P peak set to 23rd March 2000.
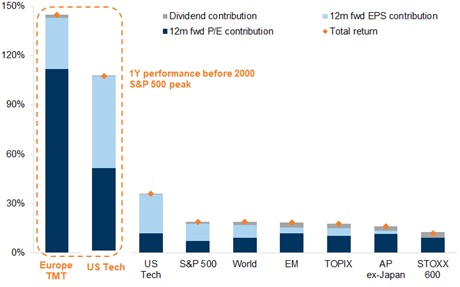
Source: Goldman Sachs
While it appears that we are not in a bubble yet, high levels of market concentration and increased competition in the AI space suggest investors should continue to focus on diversification and be prudent in assessing their asset allocation strategy to ensure it remains fit for purpose.

