Quick Bite – Where are Share Market Valuations Right Now?
Now that we have inflation data out of the US disclosed (in line with expectations) and markets expecting a Fed rate cut in September, and the RBA rate cut on Tuesday of 25bp from 3.85% down to 3.6%, where does that leave share market valuations?
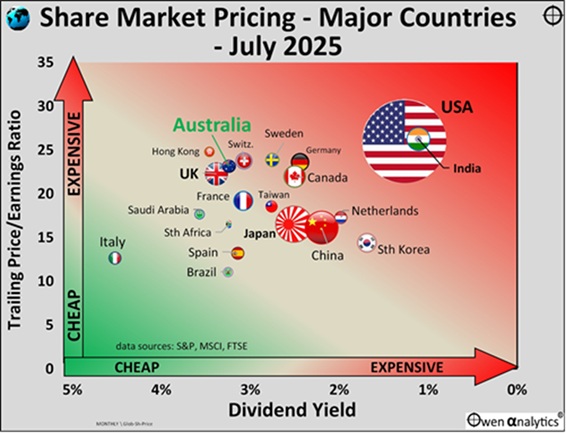
Source: Owen Analytics
Ashley Owen of Owen Analytics produces excellent charts that capture and illustrate investment insights very well.
The chart above is a great example of his work, providing an update on share market pricing around the world, based on the two most widely used measures – price/earnings ratios (he uses historic or trailing earnings rather than future earnings) and dividend yields. The chart plots share market pricing for the 20 largest share markets in the world (which together account for more than 95% of total global share market value), and the size of the symbol for each country represents the relative size (market cap) of each country’s share market.
Key take-outs include the following:
- Australia appears less expensive – but still over-priced given its market structure and sector mix.
- USA and India are way out in over-priced territory.
- Sweden, Germany, Switzerland look reasonably fully valued.
- Italy, Brazil, Hong Kong, Spain and Saudi Arabia look relatively cheap.
- Japan and China appear reasonably priced.
The US market is the main reason for the current expensive level of pricing of the overall global share market. The chart uses the S&P1500 Composite index (largest 1,500 US companies) as it offers a more comprehensive picture of the overall US share market than the S&P500 index. At the end of July 2025, the trailing P/E ratio for the narrow S&P500 index was significantly higher (more expensive) at 29.3x, compared to 26.0x for the broader S&P1500 index. That said, in the Q2 reporting season, we have witnessed substantial and better than expected growth in earnings – which was not reflected in the trailing earnings to end July.
Without the US, the ex-US global share market would be much more reasonably priced, at 19x earnings and a dividend of 2.5%.
The US and India are by far the most expensive on both measures, with both markets trading on significantly higher pricing (higher P/E ratios and lower dividend yields) than their historical averages. The US market is expensive mainly because of the ‘Magnificent Seven’, which continue to dominate global tech spending and keep on delivering to very high expectations.
It is only to be expected that different countries will have differently priced equity markets – reflecting growth prospects, market composition, historical norms, currency strength or weakness, the transparency of the legal and corporate regulations, etc.
How are Australian shares valued?
Relative to other countries, Australia appears less over-priced than most. However, its trailing price/earnings ratio of 23x profits is very high (expensive) relative to its historical average P/E ratio of 12.5x since 1945, and 15.8x since 1980. Australia’s current P/E ratio is in the 97% percentile rank of historical P/Es – that is, it has only been more expensive 3% of the time. On a prospective basis, the P/E ratio for Australia is 20x, versus a long term average of around 14.5x.
On dividend yields – the ASX’s current dividend yield of 3.2% is relatively high compared to other countries, but it is low (expensive) relative to its own historical median dividend yield of 4.2% since 1945, 4.1% since 1980, and 4.0% since franking was introduced in 1987. The current dividend yield of 3.2% is in the lowest 6% percentile rank of historical dividend yields – it has been higher 94% of the time.
However, one can add a further 1.1% return from franking credits this year (for zero tax bracket Australian investors). Nevertheless, even with franking credits, the current ‘grossed-up’ dividend yield is near record lows for the Australian share market.
Therefore, while the Australian market looks ok relative to other countries, it is expensive relative to our market’s historical trends and structure, especially since our market is dominated by two sectors that ordinarily should trade at relatively low P/E ratios and relatively high dividend yields – banks and miners.

